Public Finance
The public finance-focused App Summary Page helps investors understand how an app's key performance indicators are trending over the most common time horizons: trailing 12 weeks year-over-year, quarter-to-date, and quarterly year-over-year.
The page is organized into three main sections:
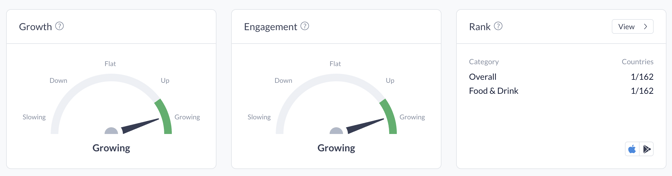
KPI Gauges
Growth and Engagement gauges show how these KPIs are trending over the preceding 12 weeks year-over-year: Slowing, Down, Flat, Up, or Growing.
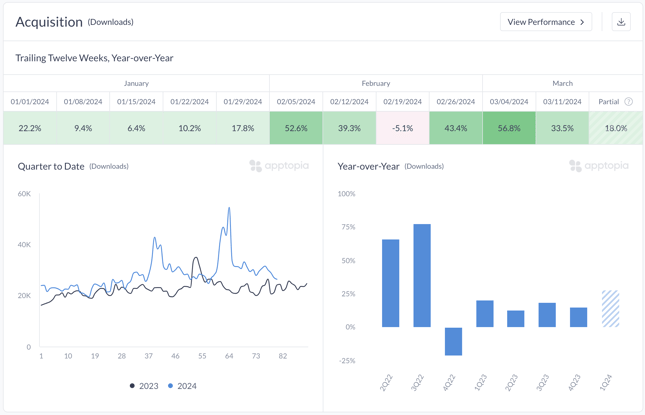
Growth/Acquisition
View Downloads growth three ways:
- Trailing 12 weeks year-over-year
- Daily Quarter-to-Date vs same period last year
- Trailing 8 quarters year-over-year percent change
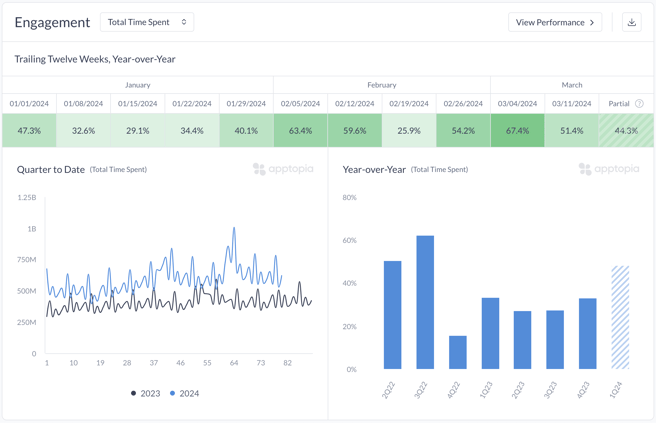
Engagement
Measure Engagement growth in MAU, DAU, Total Number of Sessions, or Total Time Spent. View growth three ways:
- Trailing 12 weeks year-over-year
- Daily Quarter-to-Date vs same period last year
- Trailing 8 quarters year-over-year percent change